A functional vulnerability framework for biodiversity conservation
Auber A., Waldock C., Maire A., Goberville E., Albouy C., Algar A.C., McLean M., Brind'Amour A., Green A.L., Tupper M., Vigliola L., Kaschner K., Kesner-Reyes K., Beger M., Tjiputra J., Toussaint A., Violle C., Mouquet N., Thuiller W., Mouillot D.
Safeguarding the most threatened ecosystems requires accurate and integrative quantification of their vulnerability and their functioning, particularly the potential loss of species trait diversity which imperils their functioning. However, the magnitude of threats and associated biological responses both have high uncertainties.
Here, we present a functional vulnerability framework that incorporates uncertainty and reference conditions into a generalizable tool. Through in silico simulations of disturbances, our framework allows us to quantify the vulnerability of communities to a wide range of threats. We demonstrate the relevance and operationality of our framework, and its global, scalable and quantitative comparability, through three case studies on marine fishes and mammals.
We show that functional vulnerability has marked geographic and temporal patterns. We underline contrasting contributions of species richness and functional redundancy to the level of vulnerability among case studies, indicating that our integrative assessment can also identify the drivers of vulnerability in a world where uncertainty is omnipresent.
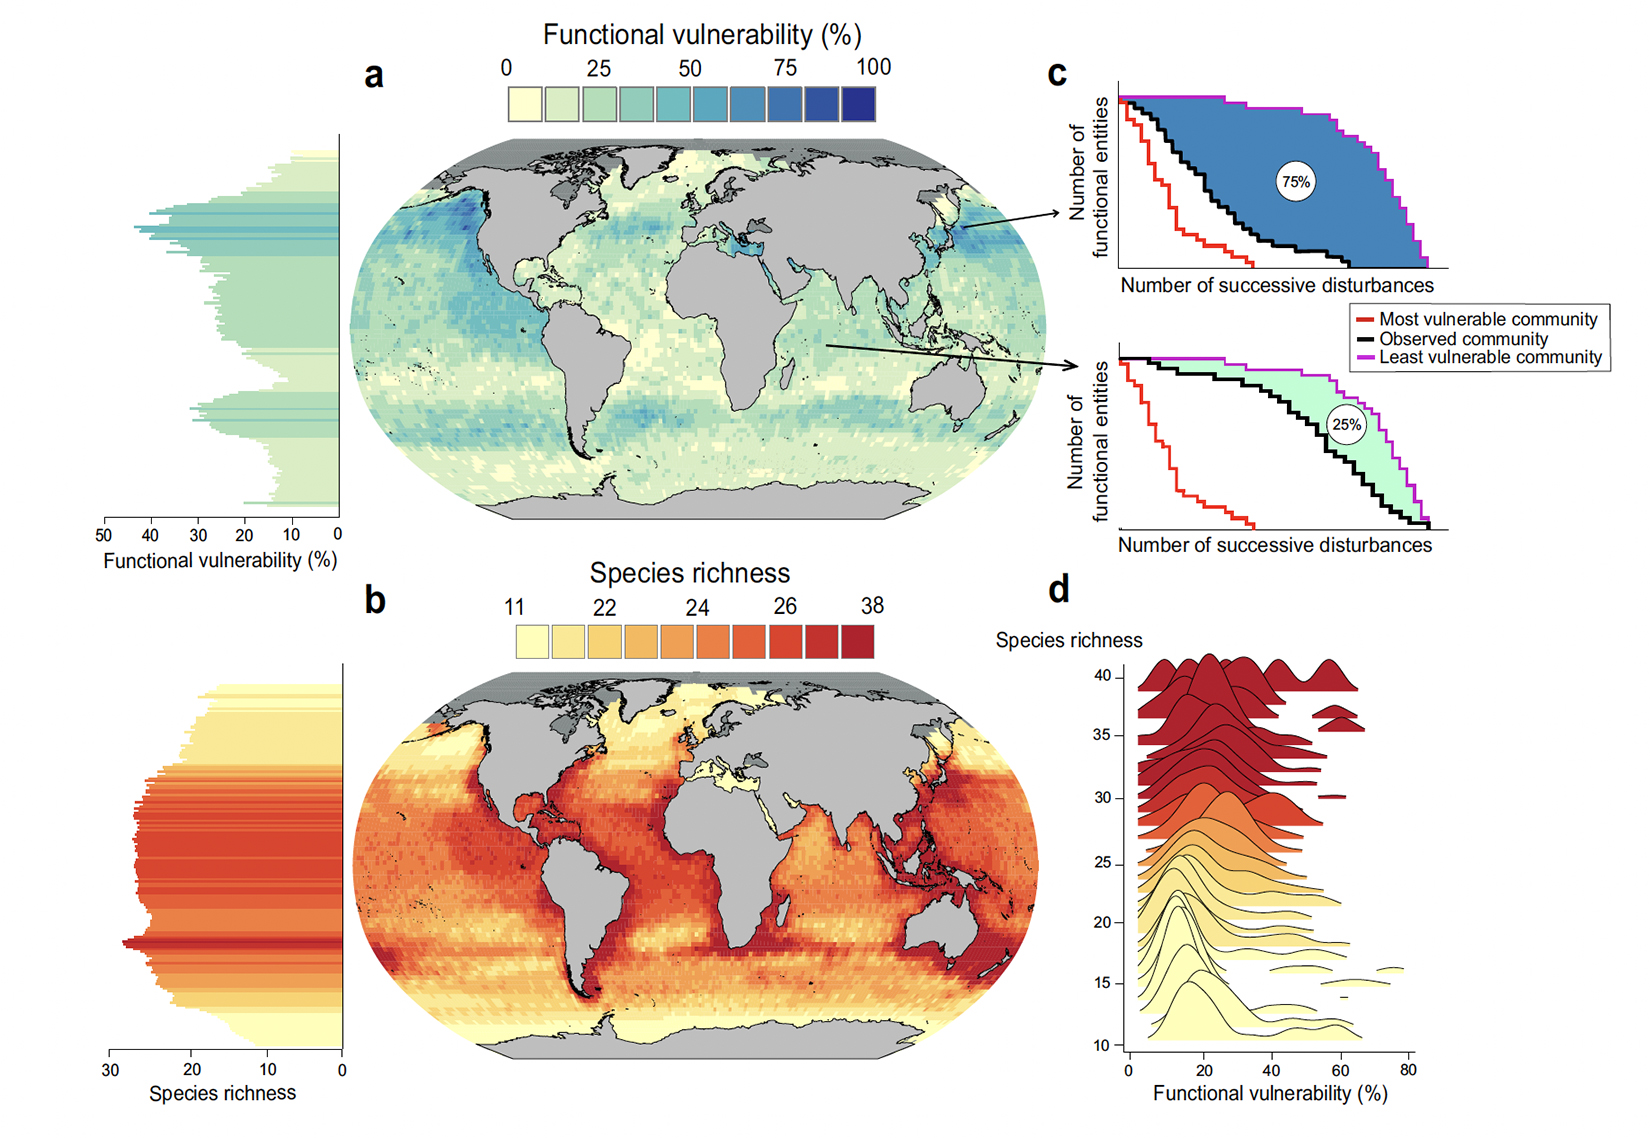
Functional vulnerability and species richness in marine mammal communities. a Functional vulnerability of marine mammal communities at global scale. b Species richness of marine mammal communities. c Rarefaction curves of two contrasting communities according to their functional vulnerability (25 and 75%). The red and violet curves correspond to the rarefaction curve of the most and least vulnerable communities, respectively. The black curve corresponds to the rarefaction curve of the observed community. d Distribution of functional vulnerability values along the species richness gradient. Sites for which species richness was inferior to 10 were not considered to prevent any over or underestimation of functional vulnerability.