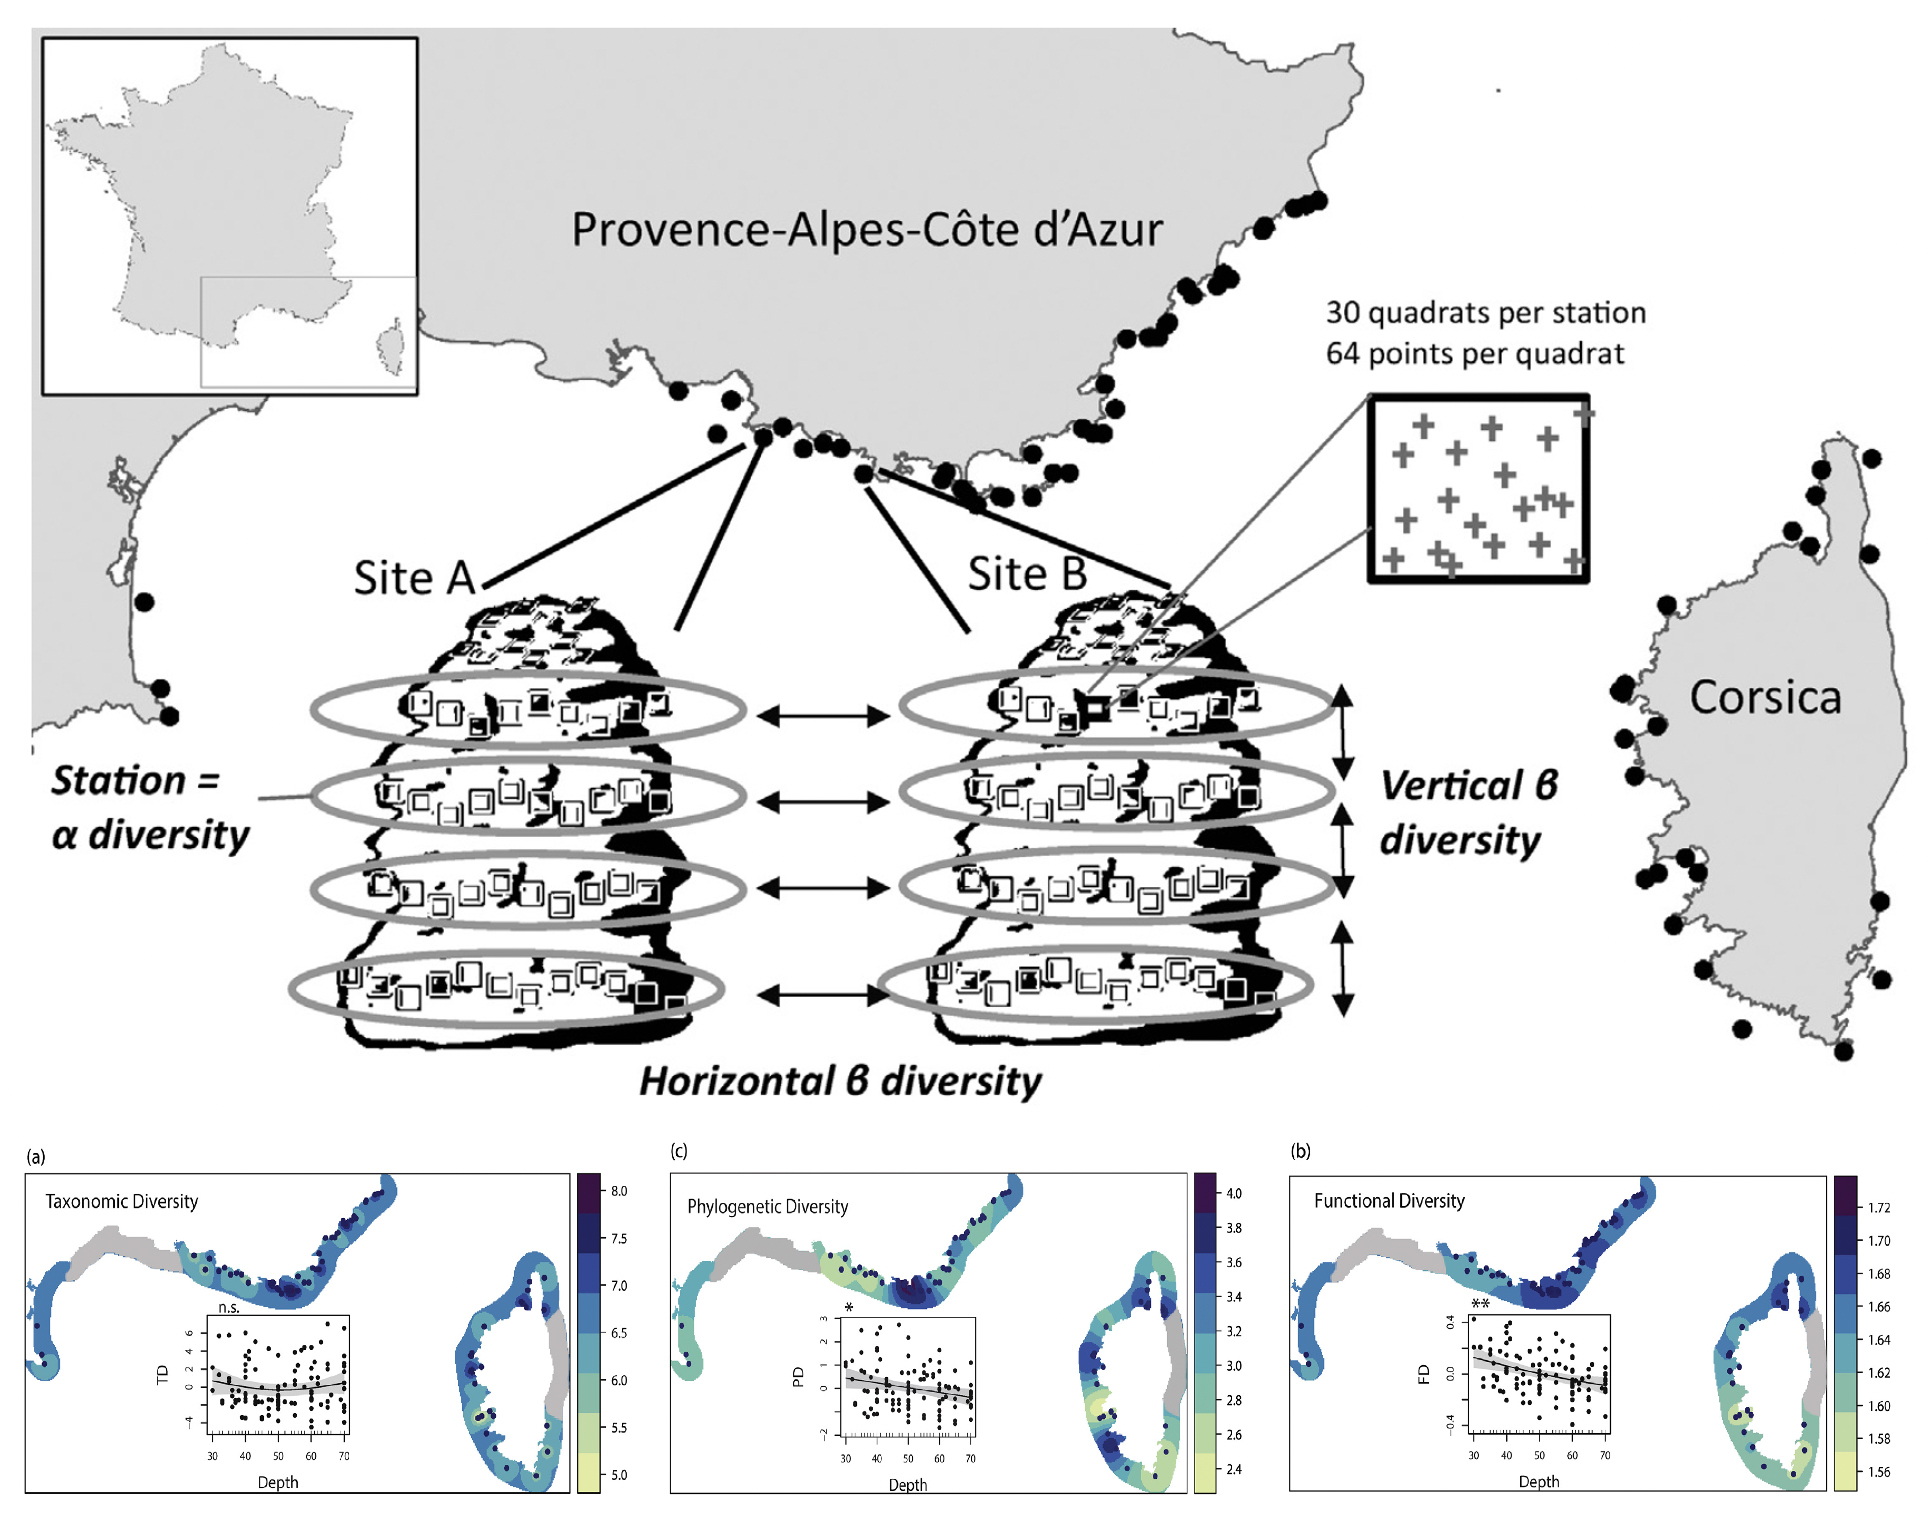
We investigated the vertical and horizontal distributions of taxonomic (TD), functional (FD) and phylogenetic diversity (PD) in a three-dimensional structured ecosystem. We focused on the Mediterranean coralligenous assemblages which form complex structures both vertically and horizontally, and are considered as the most diverse and threatened communities of the Mediterranean Sea.
Our study covers the entire range of distribution of coralligenous habitats along the French Mediterranean coasts, representing the most complete database so far developed for this important ecosystem. Our study revealed that taxonomic diversity differed from functional and phylogenetic diversity patterns at the station level, the latter two being strongly structured by depth, with shallower stations generally richer than deeper ones.
Community dissimilarities increased over depth especially in central and eastern part of the French Mediterranean littoral and in northern Corsica, indicating coralligenous vertical structure within these regions. Our results highlight the necessity of considering different depth belts as a basis for regional scale conservation efforts.