Adaptation to local resource availability depends on responses in growth rate and nutrient acquisition. The growth rate hypothesis (GRH) suggests that growing fast should impair competitive abilities for phosphorus and nitrogen due to high demand for biosynthesis. However, in microorganisms, size influences both growth and uptake rates, which may mask trade-offs and instead generate a positive relationship between these traits (size hypothesis, SH).
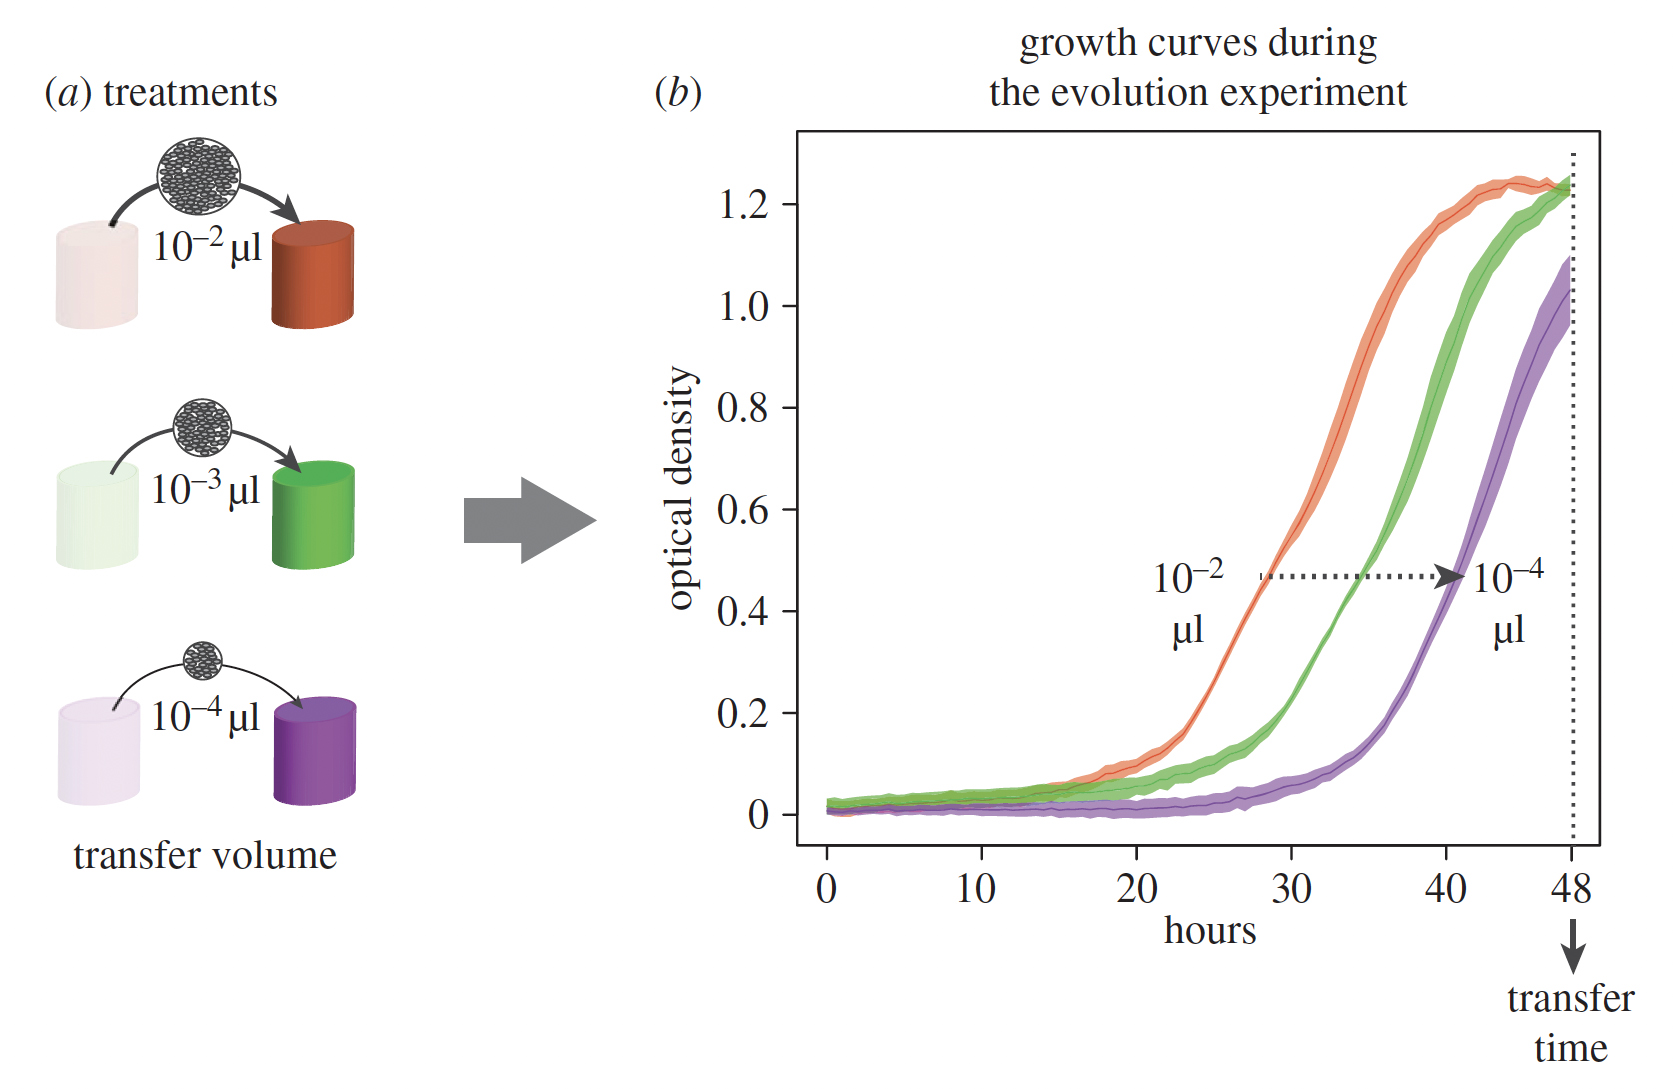
Here, we evolved a gradient of maximum growth rate (mmax) from a single bacterium ancestor to test the relationship among mmax, competitive ability for nutrients and cell size, while controlling for evolutionary history. We found a strong positive correlation between mmax and competitive ability for phosphorus, associated with a trade-off between mmax and cell size: strains selected for high mmax were smaller and better competitors for phosphorus.
Our results strongly support the SH, while the trade-offs expected under GRH were not apparent. Beyond plasticity, unicellular populations can respond rapidly to selection pressure through joint evolution of their size and maximum growth rate. Our study stresses that physiological links between these traits tightly shape the evolution of competitive strategies.