Biodiversity is thought to provide insurance for ecosystem functioning under heterogeneous environments; however, such insurance potential is under serious threat following unprecedented loss of biodiversity. One of the key mechanism underlying ecological insurance is that niche differentiation allows asynchronous responses to fluctuating environments, although the role of different ecological strategies (e.g., specialists vs. generalists) has yet to be formally evaluated.
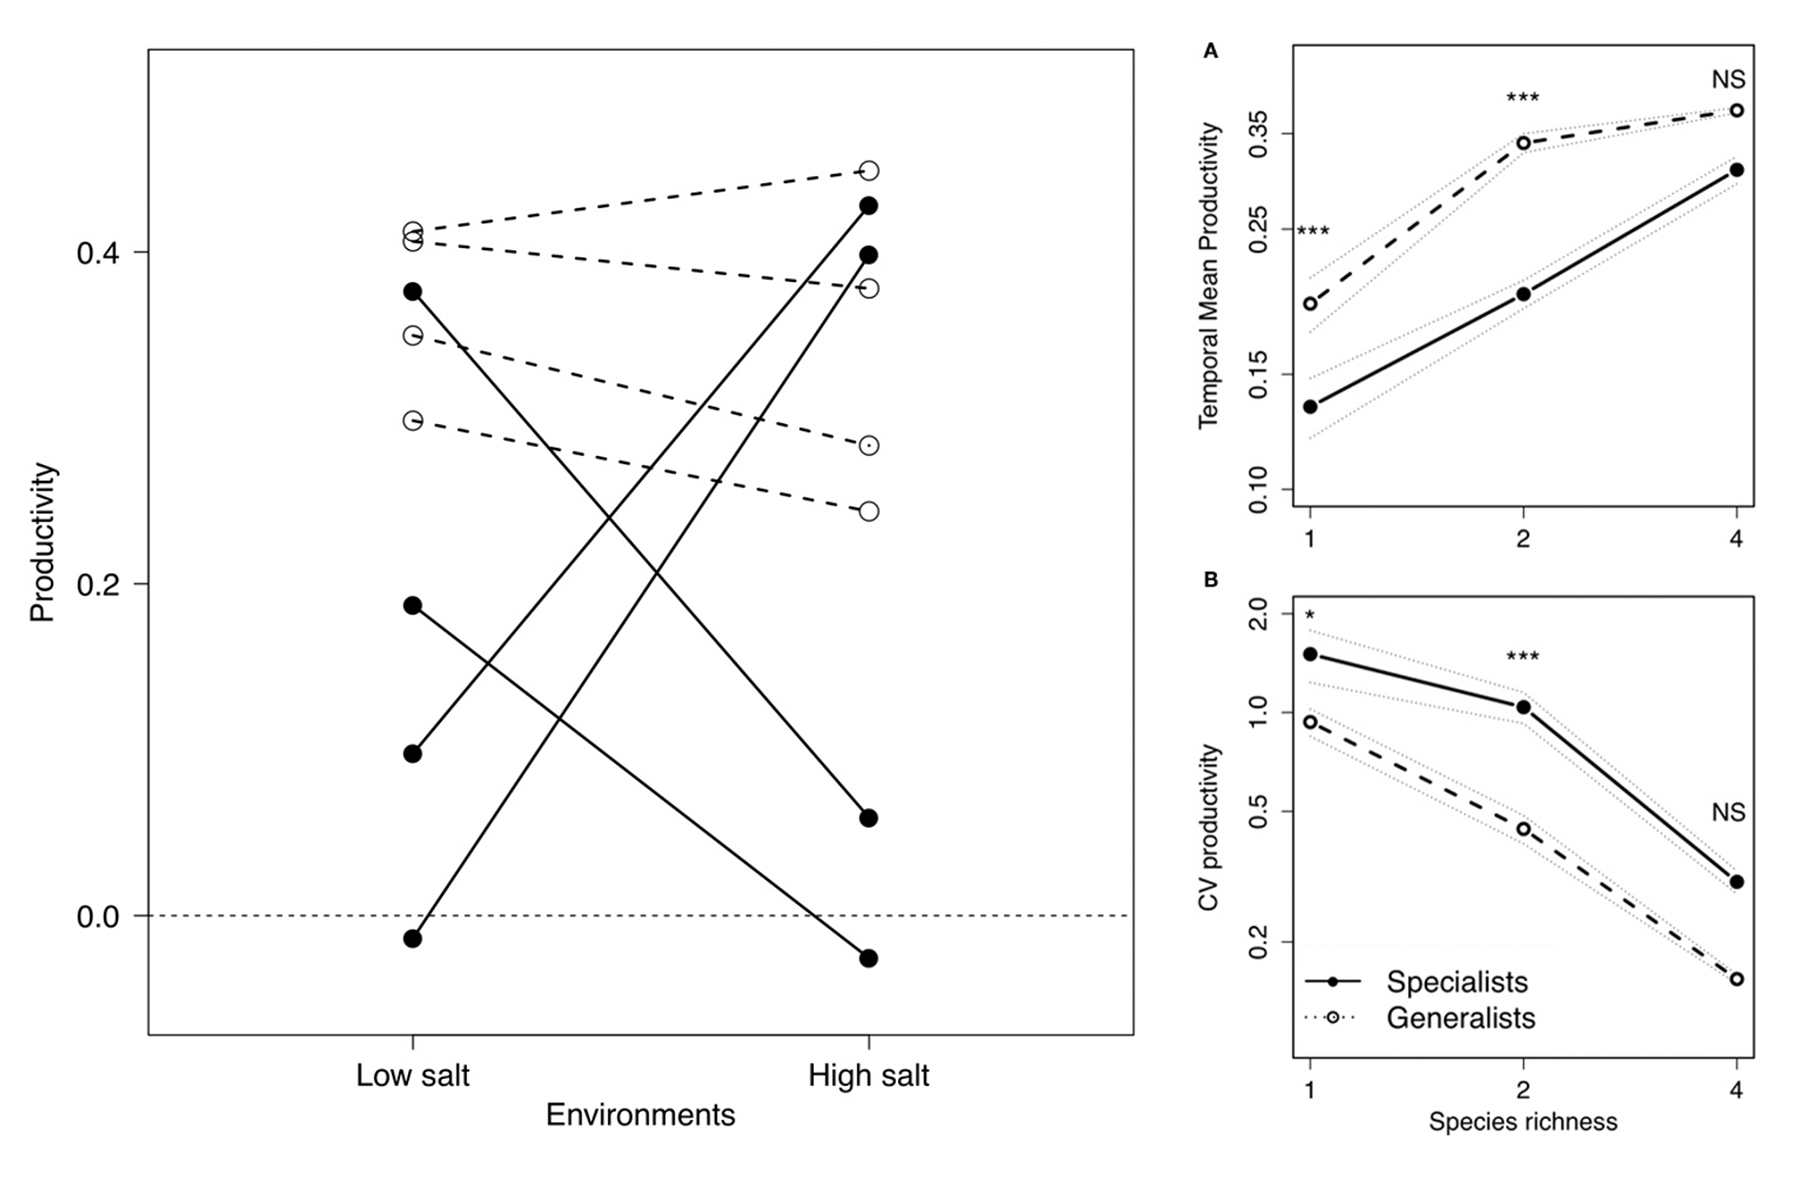
We present here a simple experimental study that illustrates how different ecological strategies (i.e., generalists vs. specialists) can shape the biodiversity-insurance relationship. We assembled microcosm of generalists and specialist bacteria over a gradient of salinity and found that, bacterial communities made up of generalists were more productive and more stable over time under environmental fluctuations.
We discuss our results in context with simple theoretical predictions and propose future directions for biological insurance theory. We argue that beyond species richness itself, it is essential to incorporate the distribution of ecological strategies across relevant environmental gradients as predictors of the insurance potential of biodiversity in natural ecosystems.