Global Ecology and Biogeography · 2014

Multifaceted diversity-area relationships reveal global hotspots of mammalian species, trait and lineage diversity

Mazel F., Guilhaumon F., Mouquet N., Devictor V., Gravel D., Renaud J., Cianciaruso M.V., Loyola R., Diniz-Filho J.A.F., Mouillot D., Thuiller W.

doi.org/10.1111/geb.12158
Download PDF
Scroll down for preview

Key Message

To define biome-scale hotspots of phylogenetic and functional mammalian biodiversity (PD and FD) and compare them with classical species richness (SR) hotspots at a global scale, we analysed 782 terrestrial ecoregions using distribution ranges of 4616 species. We applied a unified framework incorporating relative species coverage and built multifaceted diversity-area relationships to rank ecoregions while accounting for area effects, defining hotspots as top-ranked regions.

Ignoring species coverage produced apparent congruence among SR, PD, and FD hotspots, but areas rich in evolutionary history and functional diversity did not match SR hotspots, and PD and FD hotspots showed strong spatial mismatches.

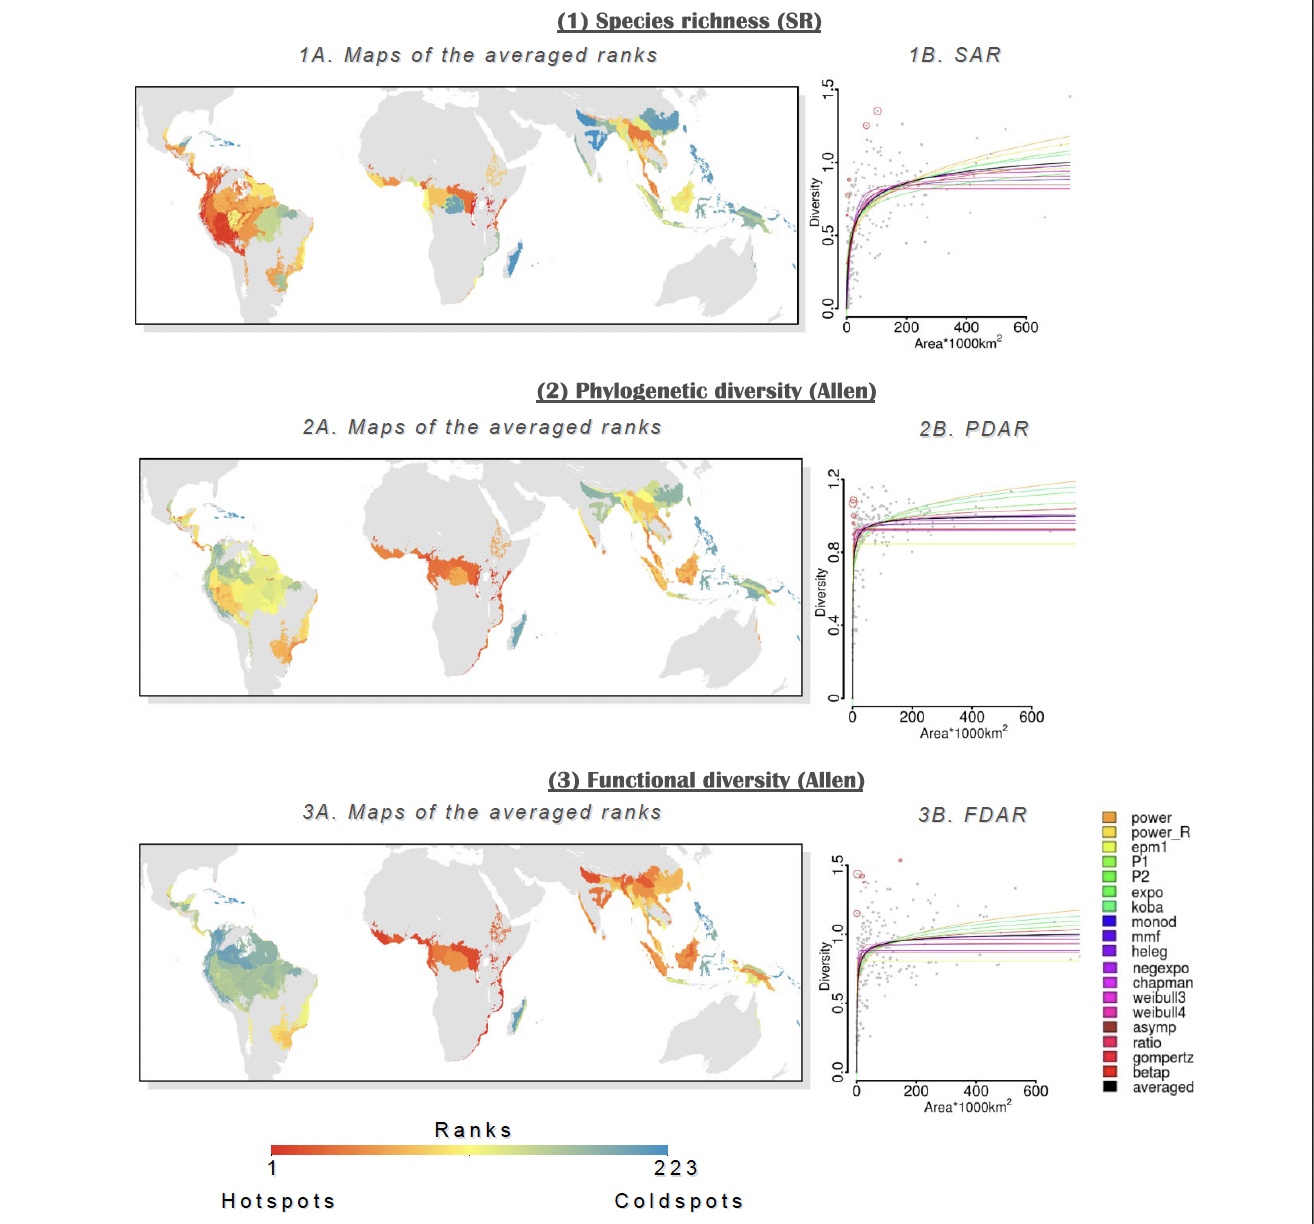
FD and PD reached maximum values faster than SR with increasing area, suggesting they may be less sensitive to habitat loss. Incorporating species coverage reduced congruence among biodiversity facets, indicating that maximizing species number alone may overlook key phylogenetic and functional components, highlighting the need for a multifaceted approach to conservation.

Figure from Mazel et al. 2014
Taxonomic, phylogenetic and functional mammal hotspot selection for tropical moist forests. For each biodiversity facet (1, species richness; 2, phylogenetic diversity (Allencor PD); and 3, functional diversity (Allencor FD)) a map (a) and a diversity area relationship (b) are presented. Graphs (b) represent the species-area relationship (SAR), phylogenetic diversity-area relationship (PDAR) and functional diversity-area relationship (FDAR). Model fits are shown with a coloured curve (see legend) and the averaged fit is presented in black. Red circles indicate hotspots, the larger the diameter, the higher the ranking. Maps (a) represent the derived ranks from the residuals of the averaged model presented in (b)
Full Article (PDF)