Trait-based ecology aims to understand the processes that generate the diversity of organismal traits and their influence on ecosystem functioning. Achieving this goal requires simplifying this complexity in synthetic axes defining a trait space and clustering species based on their traits while identifying those with unique combinations. However, little is known about the dimensionality, robustness to trait omission, and structure of these trait spaces.
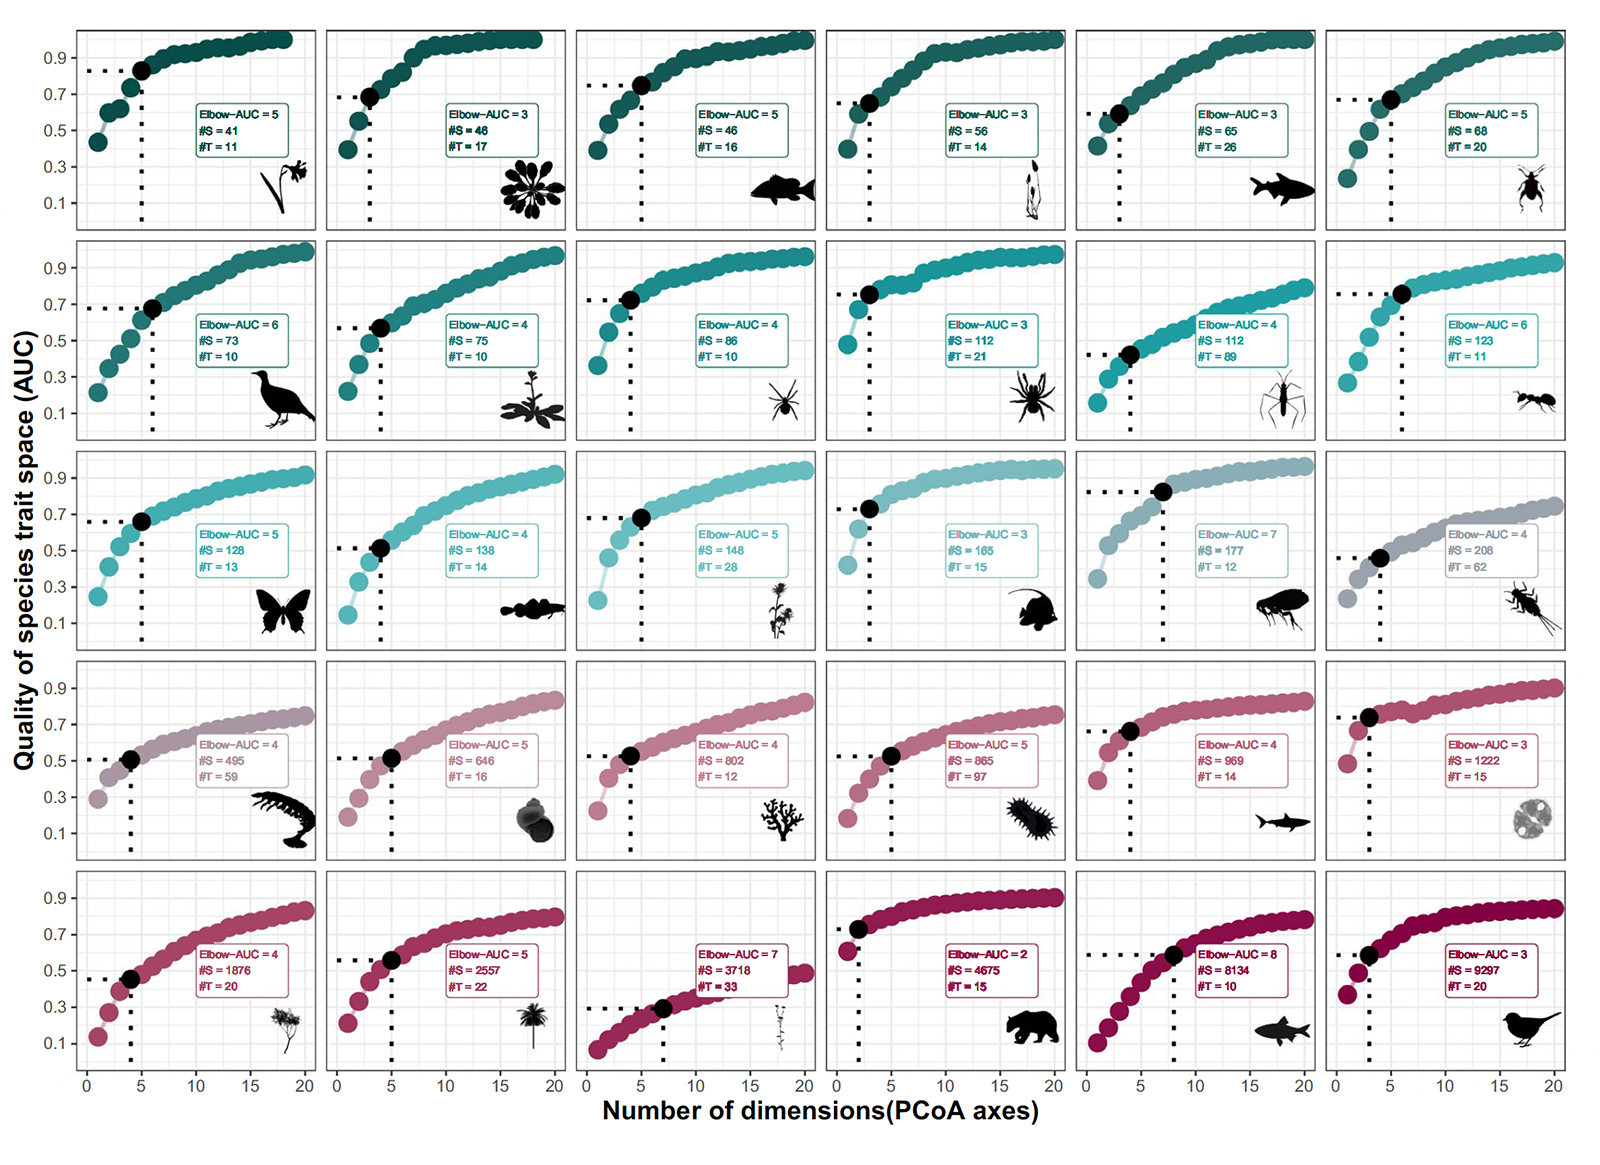
Here, we propose a unified framework and synthesize 30 trait datasets spanning a wide range of taxa, ecosystems, and spatial scales, showing that a trade-off between trait space quality and operationality emerges between three and six dimensions. Robustness to trait omission is generally low but highly variable among datasets.
We also identify invariant scaling relationships between the number of clusters, the size of the dominant cluster, and the number of unique species relative to total species richness. As species richness increases, the number of unique species saturates, while species increasingly concentrate in the richest cluster. Based on these results, we propose practical guidelines to construct trait spaces and estimate functional diversity indices.