Many previous studies have assumed that a linear relationship between local and regional species richness indicates that communities are limited by regional processes, while a saturating relationship suggests that species interactions restrict local richness. We show theoretically that the relationship between local and regional richness changes in a consistent fashion with assembly time in interacting communities.
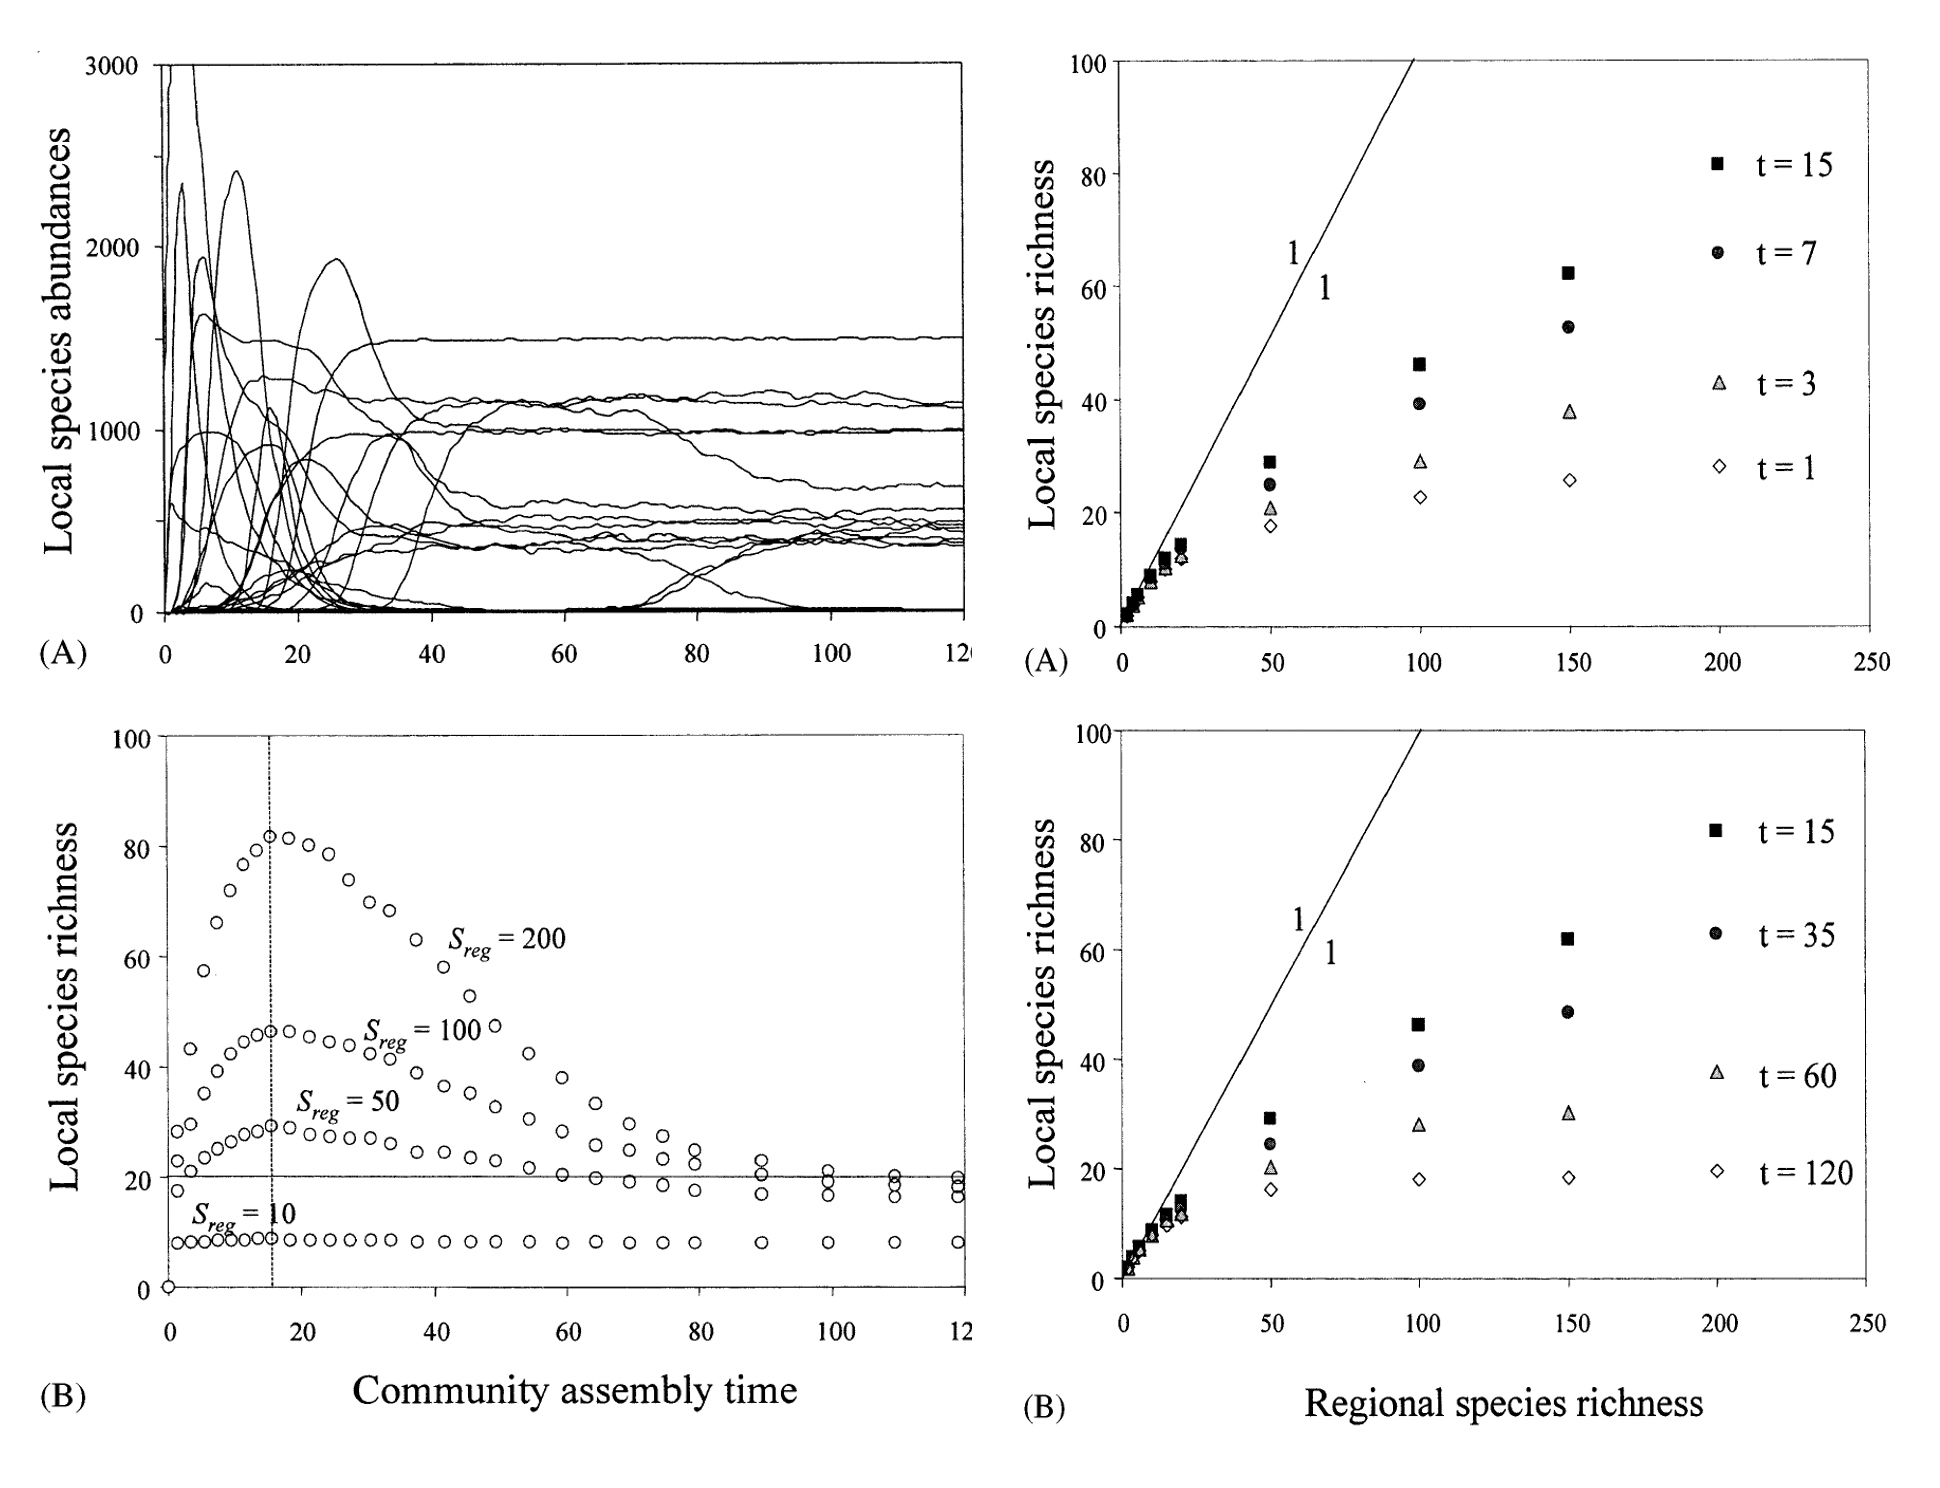
Communities show saturation in their early assembly stages because only a subset of the regional pool may colonize a locality. At intermediate assembly times, communities will appear unsaturated until significant competitive exclusion occurs. Finally, when communities reach equilibrium, we found saturation as a result of resource competition resulting in the dominance of a limited number of species.
We show that habitat size and species fecundity are important in determining the time needed for the community to reach equilibrium and thus affect the relationship between local and regional species richness. Our results suggest the number of coexisting species is a function of local and regional processes whose relative influences might vary over time and that research using the relationship between local and regional species richness to infer mechanisms limiting species richness must have knowledge of the assembly time of the community.