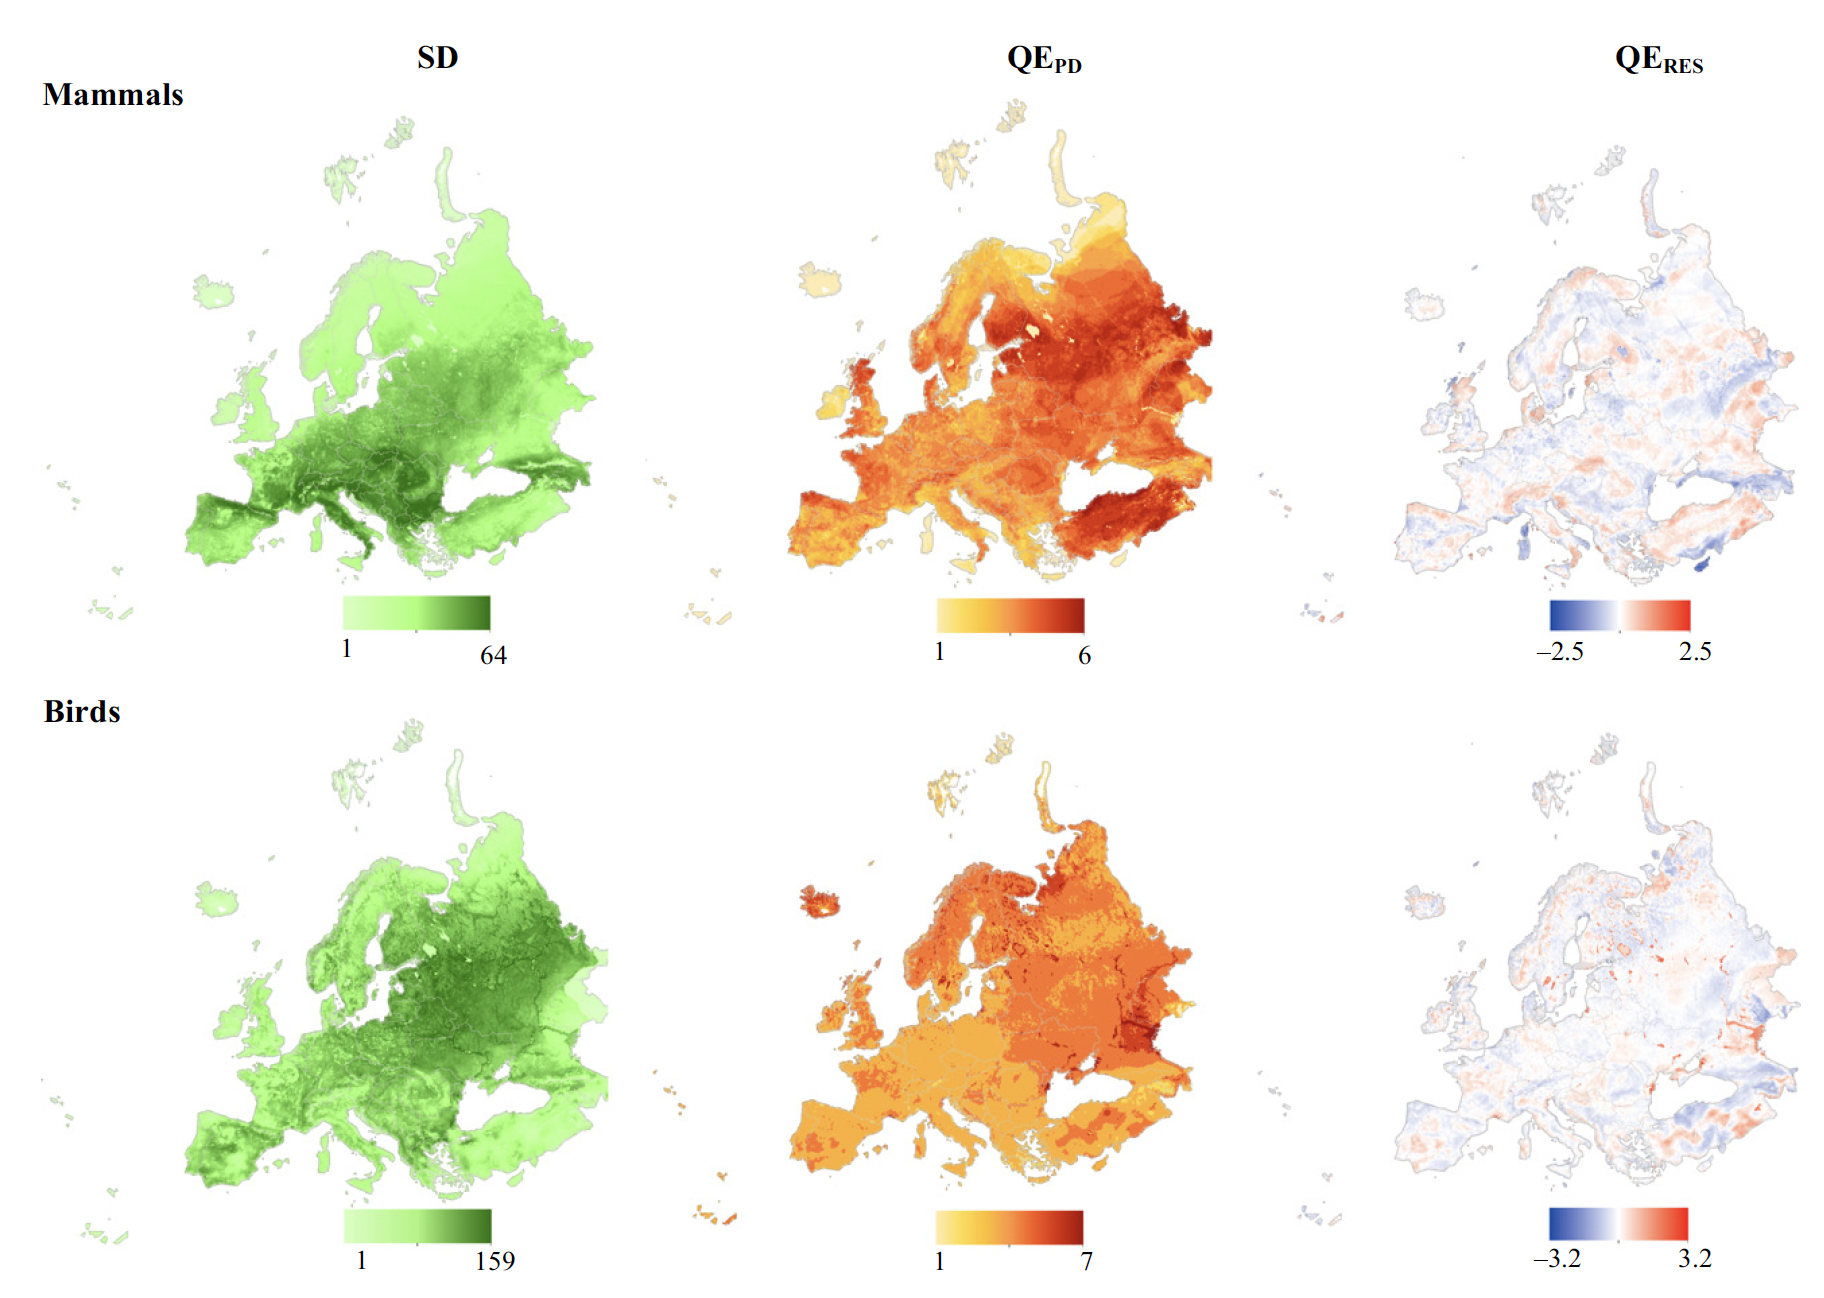
We investigate patterns of phylogenetic diversity in relation to species diversity for European birds, mammals and amphibians to evaluate their congruence and highlight areas of particular evolutionary history. We estimate the extent to which the European network of protected areas (PAs) network retains interesting evolutionary history areas for the three groups separately and simultaneously. Phylogenetic (PD) and species diversity (SD) were estimated using the Rao quadratic entropy.
We determined the regional relationship between PD and SD for each taxa with a spatial regression model and used the tails of the residuals distribution to identify areas of higher and lower PD than predicted. Patterns across vertebrates show a strong spatial mismatch highlighting different evolutionary histories.
Convergent areas represent only 2.7% of the Western Palearctic, with only 8.4% of these areas being covered by the current PAs network while a random distribution would retain 10.4% of them. Areas with higher PD than predicted are better covered than expected, while low PD areas are undersampled. Although Europe has the world most extensive PAs network, evolutionary history of terrestrial vertebrates is unequally protected.